

Few decisions in biologics development shape a program as much as the choice of production cell line, the culture conditions, and the fed-batch strategy. Those choices set how much drug product a process will yield, whether the product meets its quality targets, and how soon a candidate can move toward the clinic. However, a major challenge in selecting the best cell line and growth conditions from thousands of potential candidates is picking the unique combination that maximizes titer production and critical quality attributes across varying scales. Selection criteria that are too restrictive risk culling the best-performing candidates too early, but criteria that are too forgiving risk advancing too many options to realistically test. Regardless, the end result is the program stalling.
Scientific AI presents an opportunity for teams to accelerate programs by combining historical and current experimental data to help identify only the most promising candidates to advance. Upstream teams already have a wealth of historical cell line, culture, and feed-batch data from previous campaigns. The primary bottleneck is not generating more evidence, but rather isolating and exploiting the critical data that directly drives optimal selection decisions.
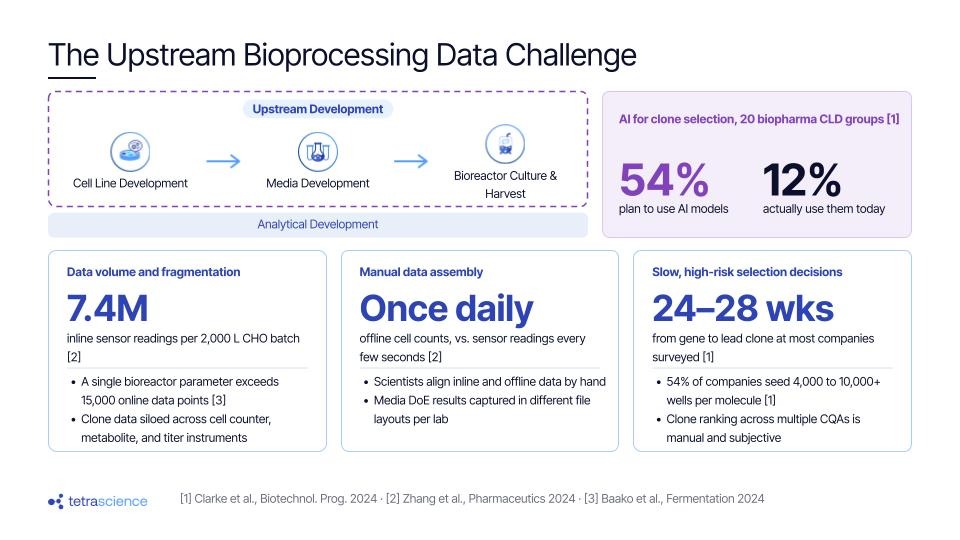
A recent BioPhorum survey of cell line development groups across 20 biopharmaceutical companies found that 54% of companies plan on using AI models to support clone selection, but only 12% actually do. What’s stopping them is the severely fragmented state of the data. The online data for a single bioreactor parameter can reach upwards of 15,000 data points2. One analysis of a commercial 2,000-liter CHO process worked with roughly 7.4 million inline sensor readings per batch, recorded every few seconds, while cell counts, viability, and metabolite concentrations were measured offline once a day3. CLD adds its own spread of sources, from proprietary bioreactor files and instrument exports to images and unstructured notes4. In most labs, the scientist is the one responsible for bringing everything together by hand.
That work adds friction to an already lengthy development process. Most companies in the BioPhorum survey take 24 to 28 weeks to move from gene to lead clone, with additional media and process development extending the path toward a production-ready process by several more weeks. The survey's authors attribute much of the variation between companies to how candidates are assessed and to the risk of deciding with limited data.
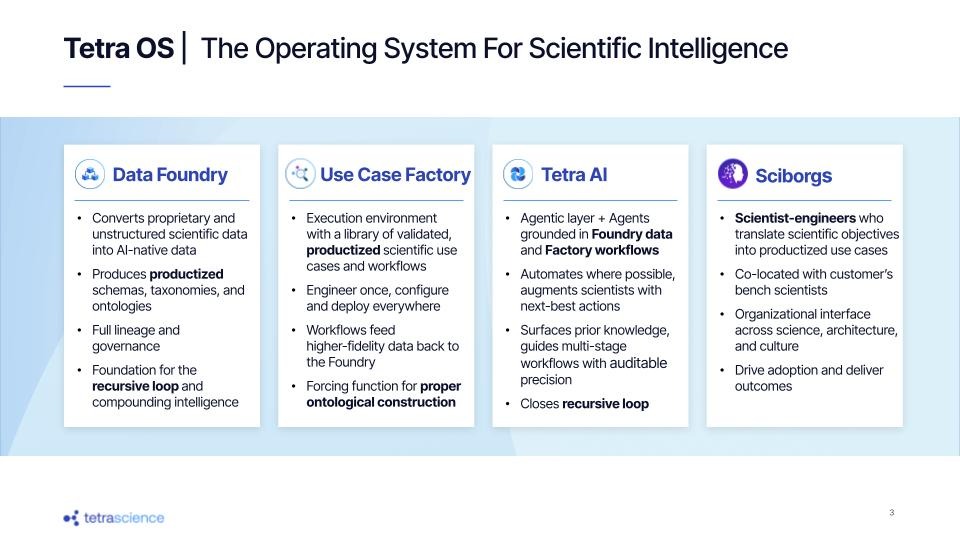
TetraScience is closing that gap with Tetra OS, the operating system for scientific intelligence, which comprises four pillars. Raw instrument and software outputs, proprietary and unstructured as they leave the lab, get converted by the Tetra Scientific Data Foundry into open, vendor-agnostic data with experimental context intact and lineage back to the source. From there, the Tetra Scientific Use Case Factory turns that data into validated applications, deployable across teams and sites without rebuilding the work each time. Tetra AI sits above both as the reasoning layer, grounding agents and models in what the Foundry has already prepared. Sciborg teams, TetraScience's embedded scientist-engineers, work inside customer programs to get these tools running and adopted.
A data foundation built for upstream work
TetraScience’s scientific applications, such as Lead Clone and Media Selection Assistant (LCMSA) and Cell Culture Insights (CCI), are built on Tetra OS to empower upstream scientists to harness the power of their data to accelerate clone and media selection timelines and provide full visibility into bioreactor growth performance. The Foundry, as mentioned, connects and harmonizes discrete result data from cell counters, metabolite analyzers, titer assays, and imaging systems with continuous data streams from bioreactors. Upstream data becomes accessible for analytics and scientific AI applications with full data lineage that maps back to the instrument that produced it.
The Factory is where replatformed workflows and applications such as LCMSA and CCI come to life for upstream scientists. LCMSA supports two major decisions in early upstream development: which clones to advance and which media conditions best support them. CCI carries the same connected data foundation into cell-culture and process-development studies, where scientists need to understand how those cells behave batch-by-batch. It trends critical process parameters across bioreactor batches, detects anomalies within batch runs, and lets scientists find and chart their data in plain language. Both applications were developed in partnership with upstream scientists at a top-30 pharmaceutical company, which grounds each feature in how working scientists screen clones and run bioreactors.
Choosing the lead clone
Cell line development (CLD) can follow different paths across organizations, but the goal is the same: narrow a large population of cells to a small number of clonally derived candidates with the growth, productivity, stability, and product-quality characteristics needed for manufacturing. In many workflows, transfection and pool screening precede single-cell cloning; from there, teams generate and evaluate thousands of clonally derived candidates, and the scale can be substantial. In the BioPhorum survey, almost half of respondents reported seeding up to 2,000 wells per molecule, while 54% seeded between 4,000 and 10,000+ wells. Teams must establish evidence that each resulting colony originated from a single cell, often requiring review of thousands of images.
From there, CLD becomes a successive down-selection process. Thousands of candidates are reduced to hundreds, then dozens, and eventually to a small set taken into more representative fed-batch studies. Growth and productivity drive much of the early screening. As the field narrows, product quality, stability, and performance in scale-down bioreactor models become increasingly important. Throughout that process, teams collect measurements such as viable cell density, growth rate, titer, metabolites, and imaging data across clones and time points. Scientists then aggregate those results to compare candidates, decide which clones to advance, and support successive rounds of down-selection.
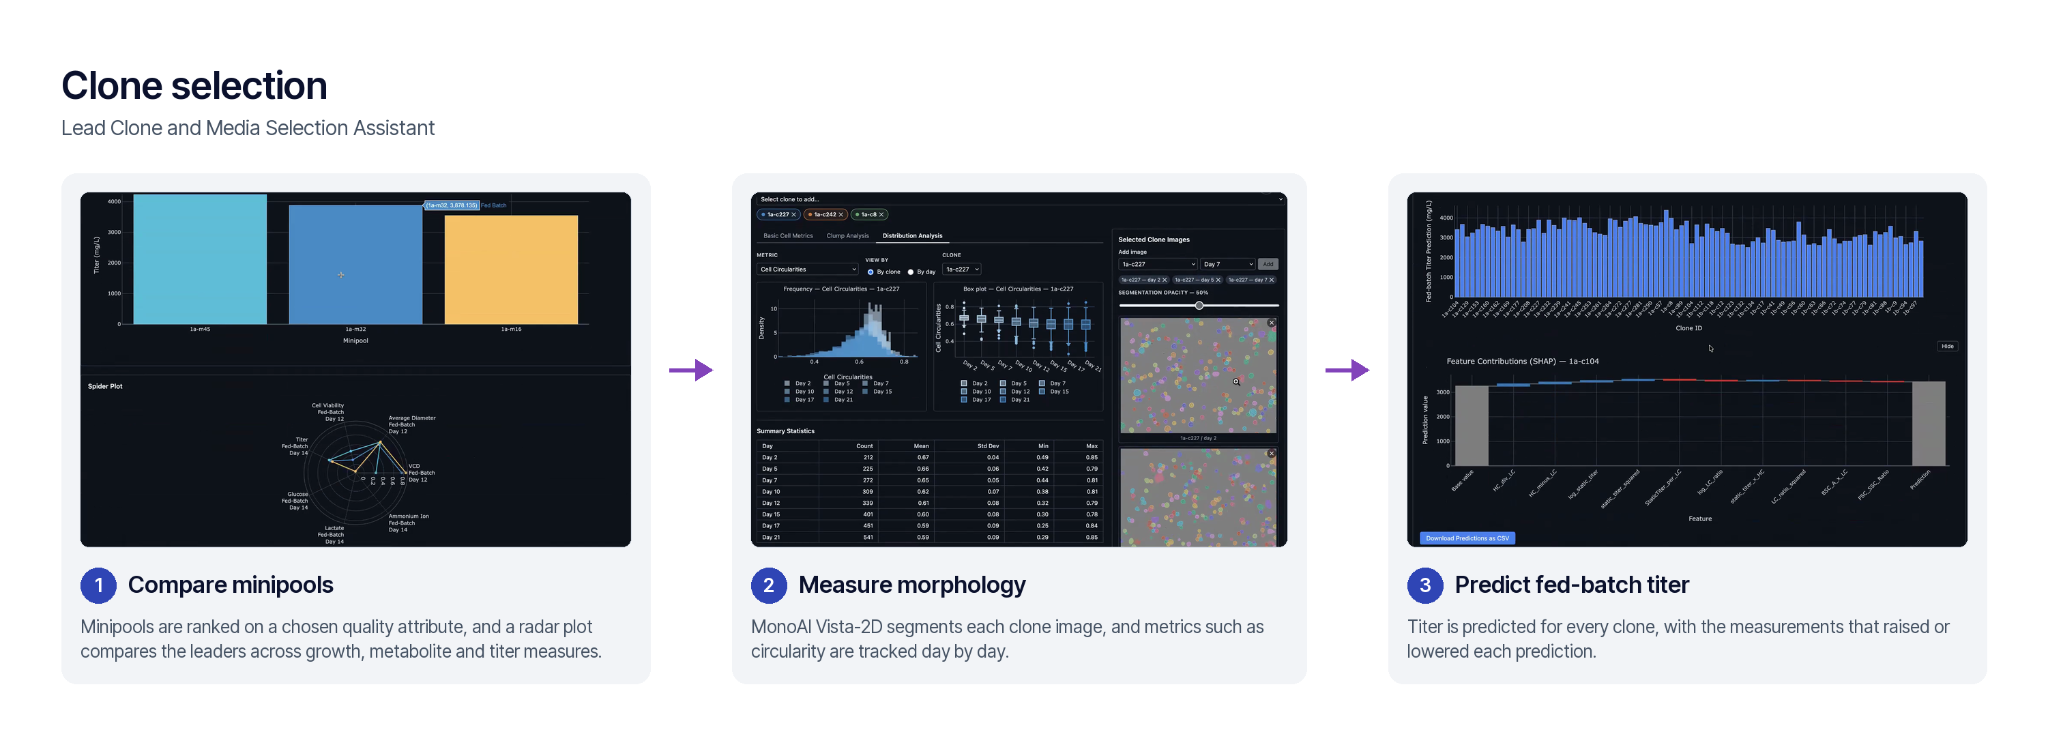
LCMSA gives the scientist that full picture in one place, following the work from minipool selection through cloning. Growth, productivity, metabolite and imaging data for every candidate sit in a single view, linked to the experiments that produced them. Candidates are ranked on the quality attributes the team selects, and radar plots compare the leaders across all candidates at once. A titer prediction model estimates fed-batch titer for each clone from early-culture measurements. It also shows which measurements raised or lowered each prediction, so a team can decide sooner which candidates to move into follow-on work such as stability studies.
Morphology shows how much additional insight from image data goes unused. In some workflows, the volume of images makes longitudinal morphology review impractical, so only a fraction of that information contributes to down-selection. Image analysis in LCMSA, powered by NVIDIA’s MONOAI Vista-2D foundation computer vision model, segments each image into cells, debris, and media; then measures cell count, area, circularity and clumping for every clone at multiple imaging days. Scientists can open any image with its segmentation overlay to check the result, and morphology becomes a measured input weighted alongside growth and titer. Figures and summary tables are all available for exporting to the electronic lab notebook.
Selecting the media
CLD workflows deliberately control media conditions during clone screening using a platform medium so candidates can be compared on a common basis. When the top lead clones are selected, the question shifts from which clone performs the best to which basal media, feeds, and supplementation strategy bring out the best performance in those selected candidates. As development progresses, teams also evaluate how those choices interact with process parameters such as pH, temperature, and feeding strategy. These studies are typically run as design of experiments (DoE), but the resulting DoE data are often captured differently from lab to lab, with variation in file layout, column names, and data structure.
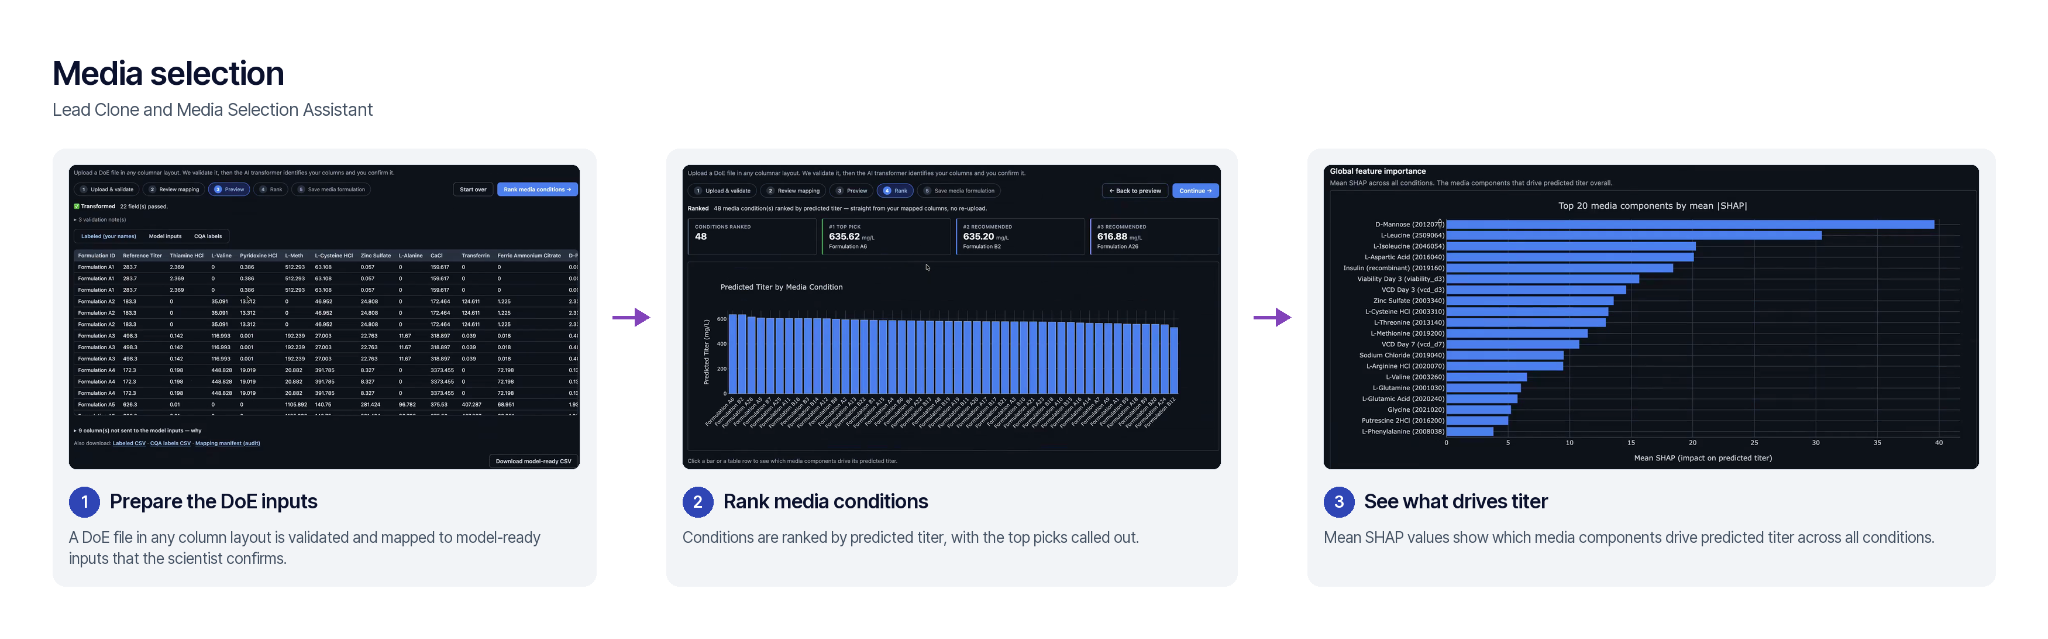
LCMSA accounts for that DoE data variation by applying an AI-assisted context mapping agent. A scientist uploads their DoE results in any columnar layout, and the application then validates the input column mapping to the media titer prediction model outputs. Each proposed term matching has a confidence score and justification. The scientist reviews and approves the final term mapping before the titer prediction model runs.
The titer prediction model ranks the conditions for the selected clones by predicted titer. For each condition, a chart shows how much each media component raised or lowered that prediction, and a second chart shows which components most influence predictions across the whole experiment. The team leaves with a prioritized set of conditions and a breakdown of which media components drove each prediction, according to the model.
Keeping the batch on track
In the bioreactor, performance depends on process parameters such as pH, dissolved oxygen, temperature, agitation, and feed delivery. As development progresses, parameters shown to affect CQAs may be designated and controlled as critical process parameters (CPPs). These conditions shape how cells grow and what they produce. Keeping important process parameters within their established operating ranges reduces one major source of variability in culture performance and product quality. A parameter that drifts outside them can lower yield, and in the worst case, result in batch loss.
Accurately measuring and recording CPPs is challenging because upstream teams manually wrangle diverse data sources in a siloed ecosystem. Sensors stream values every few seconds, while cell counts, viability, and metabolite results arrive once a day from separate instruments. The exact time a sample was pulled and recorded can be subjective, with many workflows defaulting to report sample pulls at midday regardless of when the actual pull occurred. This makes sample-derived data hard to place accurately on the timeline, and feed calculations can miss volume fluctuations caused by sampling and additions. Scientists are therefore forced to invest their time in manual data wrangling that combines bioreactor continuous and discrete data sources, rather than applying rigorous statistical analyses to flag anomalous trace behavior. As a result, a deviation that starts overnight goes unnoticed until the following morning.
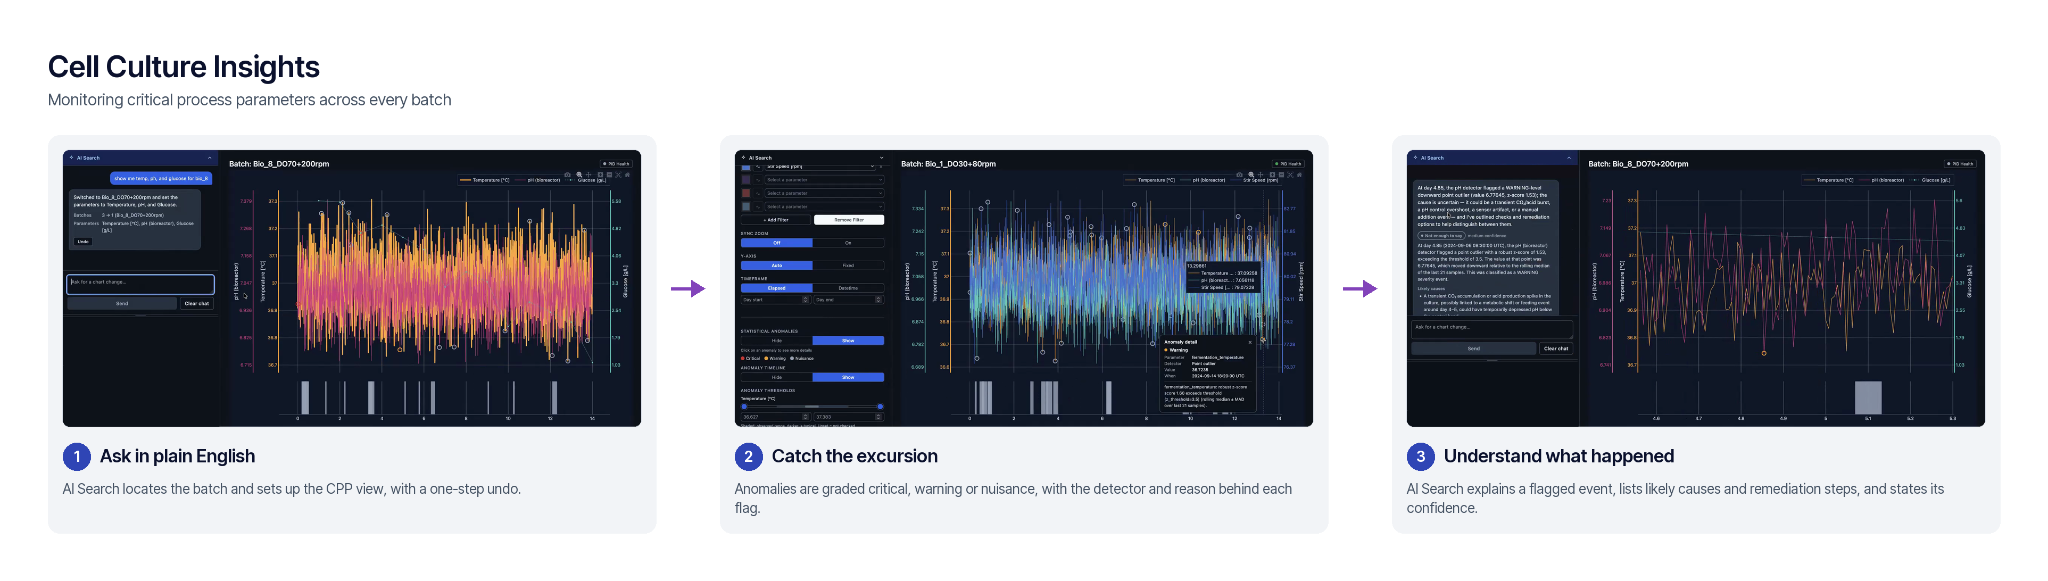
Cell Culture Insights places continuous sensor data and daily offline measurements for each batch on one timeline, reconciling parameter names across different data sources by applying an upstream common data model. The upstream common data model provides an instrument-agnostic data model that accurately and reliably connects diverse data sources with their experimental context. This design enables CCI to implement growth charting tools for near real-time CPP trending. Scientists can trend one parameter across many batches or many parameters for one batch. As the batch progresses, anomaly detection flags point outliers, level shifts, drift, flatlines, out-of-range values, and data gaps, grading each anomalous event as critical, warning, or nuisance. Each alert is connected to the detector that deviated. Scientists control and tune the thresholds for every parameter.
Scientists need more than data access to CPP measures; they also need an easy-to-navigate user interface that allows them to perform customized data search and filtration settings against complex, multi-variate datasets. The business informatics (BI) era resulted in countless dashboards that users never adopted because the data filter settings were too complex for users to successfully navigate.
CCI tackles the data search user experience challenge with an intuitive natural language search capability. Instead of manually clicking and applying filters, the scientist types a request such as "show temperature, pH and glucose for batch 8." CCI then leverages a large language model to locate the corresponding batch data in the upstream common data model and configures the appropriate filter conditions to render the matching CPP charting views. The same natural language search experience also helps users interrogate and explain flagged anomaly events. For example, when a user prompts about a pH anomaly, the system determines which detector generated the anomalous result and determines what the likely failure causes could be, such as acid build up, control overshoot, or a sensor artifact. Next, CCI uses these proposed failure events to help users identify necessary remediation steps. Finally, the user can export all CPP charts into a formal report that can be exported and logged into the experiment’s notebook.
The full picture yields smarter decisions
Upstream teams already know what scientific AI could do for them, and more than half of the groups in the BioPhorum survey plan to bring modeling into their CLD workflows. What has held them back is the data: too much of it, in too many forms, assembled by hand. TetraScience’s Tetra OS closes that divide and will change how upstream development teams operate. The Foundry harmonizes instrument and sensor data with experimental context the moment it is generated. This powers an upstream common data model where the Factory can feed scientific applications like LCMSA and CCI. These tools then enable scientists to tackle tasks like data preparation, cell characterization, titer prediction, and continuous bioreactor monitoring. Ultimately, this empowers scientists to make well-informed decisions with the full picture of upstream data in front of them.
Drop us a line if you want to explore how these applications fit your upstream workflows.
---
References
1. Clarke H, Mayer-Bartschmid A, Zheng C, et al. When will we have a clone? An industry perspective on the typical CLD timeline. Biotechnology Progress. 2024;40(4):e3449.
2. Baako T-MD, Kulkarni SK, McClendon JL, Harcum SW, Gilmore J. Machine Learning and Deep Learning Strategies for Chinese Hamster Ovary Cell Bioprocess Optimization. Fermentation. 2024;10(5):234.
3. Zhang S, Chen H, Wan Y, Wang H, Qu H. A Data-Driven Approach for Leveraging Inline and Offline Data to Determine the Causes of Monoclonal Antibody Productivity Reduction in the Commercial-Scale Cell Culture Process. Pharmaceutics. 2024;16:1082.
4. Goldrick S, Alosert H, Lovelady C, et al. Next-generation cell line selection methodology leveraging data lakes, natural language generation and advanced data analytics. Frontiers in Bioengineering and Biotechnology. 2023;11:1160223.