In the high-stakes world of life sciences, data is the backbone of research, development, manufacturing, and quality. Yet for many organizations, that data sits behind a visibility wall, creating delays throughout the value chain.
For Scientific IT and Digital Transformation leaders, the mandate is clear: Improve efficiency and cut cycle time. You are no longer just managing a platform; you are managing the speed of science. Practical questions arise every day that directly impact the path to market:
- Who is using each data platform and how often?
- Why are pipelines failing, and how can we resolve them before they impact downstream stakeholders?
- How do we justify, optimize, and demonstrate the ROI of a digital investment?
Most platforms provide dashboards to report activity. But dashboards alone don’t explain why something happened or how to improve it. That gap is why Operational Intelligence – the practice of transforming near real-time data into immediate, informed decisions – is becoming critical.
Beyond Dashboards: Insights to Accelerate Science
At TetraScience, we believe seeing metrics is not enough; customers want insights. A dashboard tells you what happened, but Operational Intelligence provides the explanation on why it happened so you have clarity on what to do next.
For leaders and developers, this shift is the difference between passive monitoring to active scientific acceleration.
The Tetra Operational Intelligence Suite
To support this shift, TetraScience has built an Operational Intelligence suite designed to deliver the right information, at the right time, in the right context. It turns platform and scientific operational data into insights that drive operational efficiency and accelerate cycle time.
The suite is organized around three core capabilities.
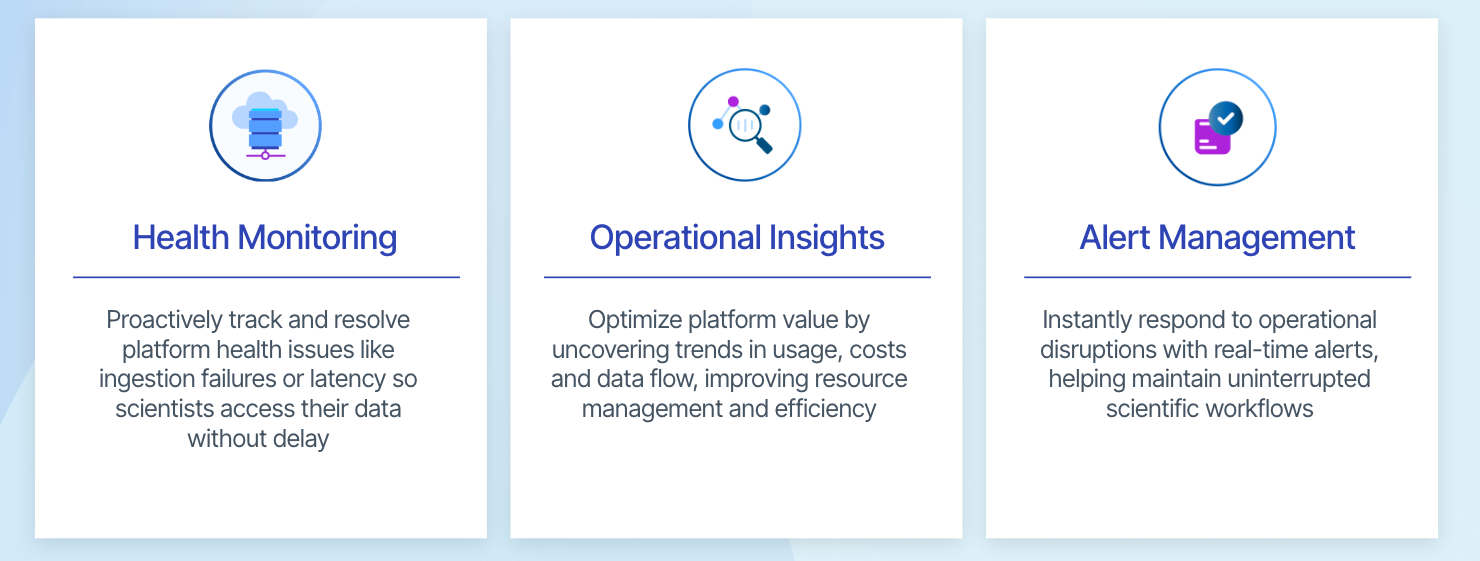
1. Health Monitoring: Deep Observability
Health Monitoring shows whether data is flowing reliably and on time across the platform.
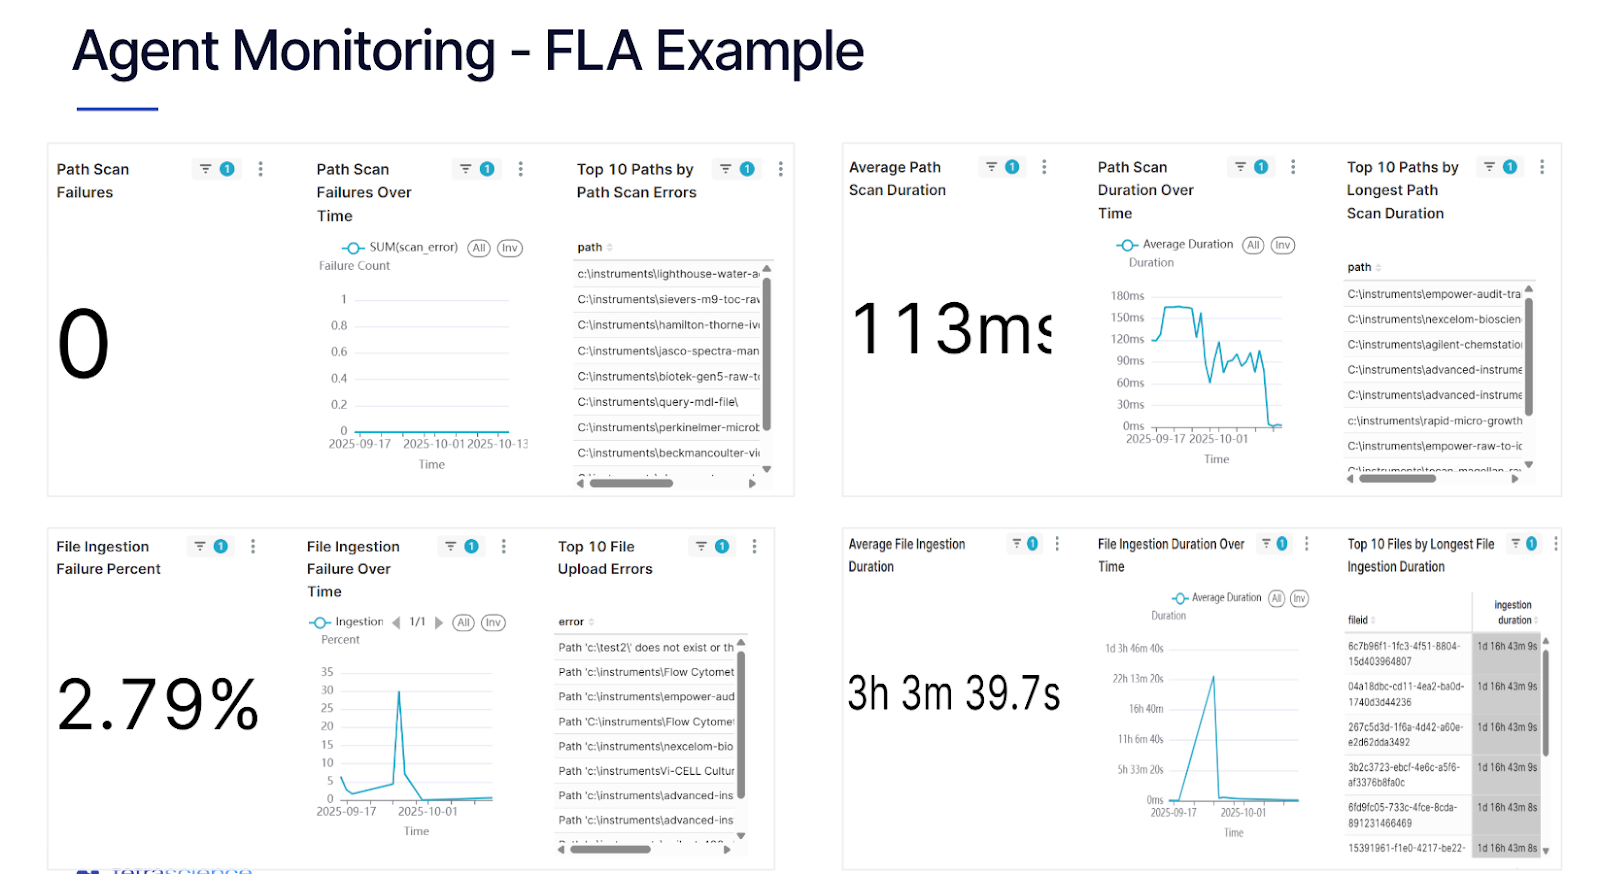
- Real-Time Connectivity: The platform frequently monitors the health of Agents, Connectors, Pipelines, and Files, including FLA, Empower, Chromeleon, LabX, and UNICORN agents.
- Proactive Intervention: Connectivity is evaluated every five minutes and components are categorized as Healthy, Unhealthy (degraded performance, e.g., high latency or >80% CPU usage), or Critical (failed). This makes it easier to spot early warning signs before failures affect downstream users.
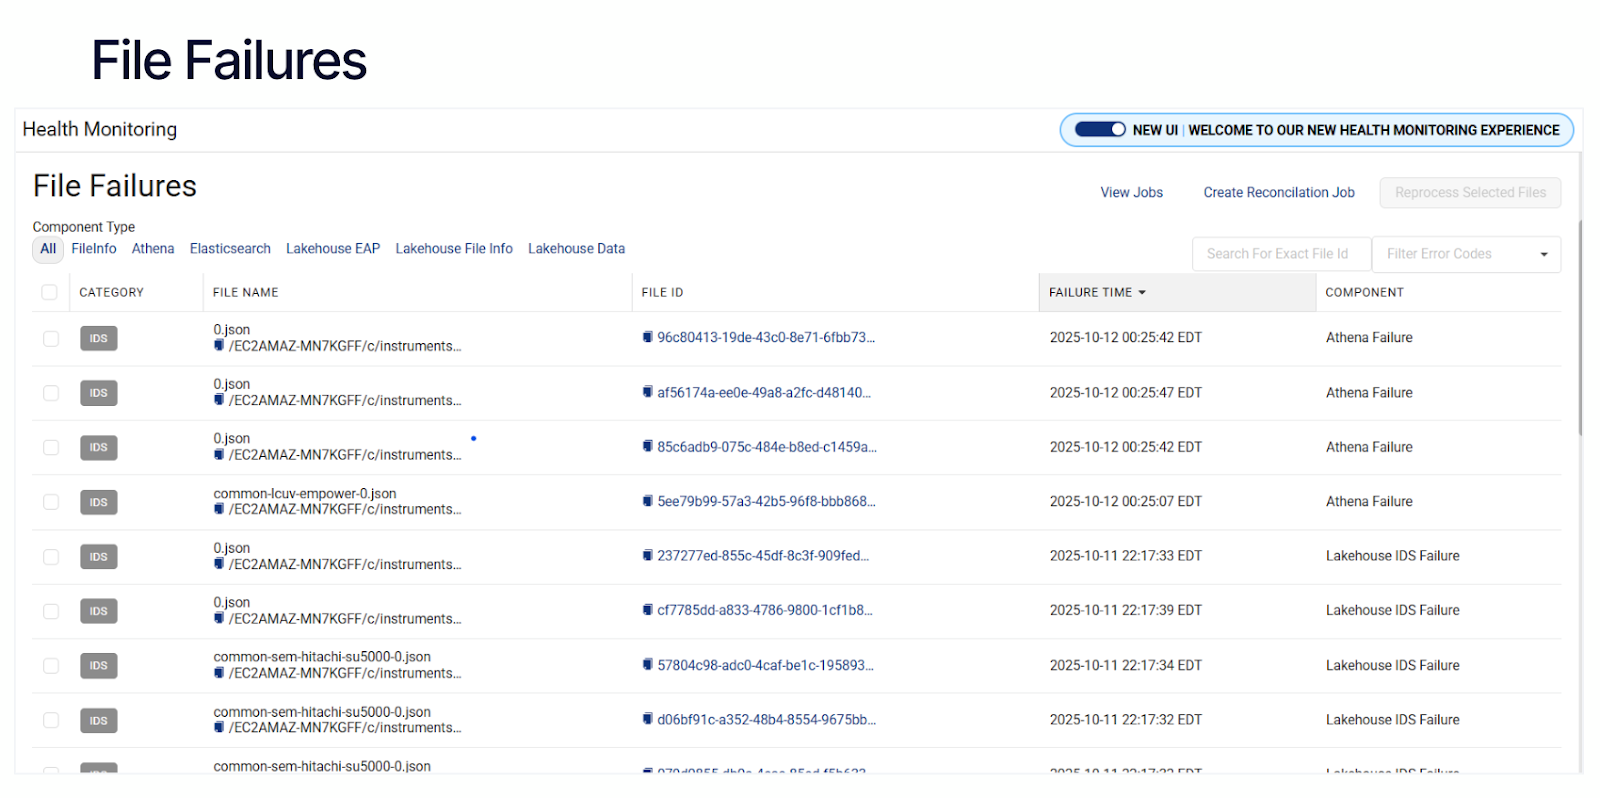
- Failure Forensics: Identify exactly which component caused a file to fail—whether it was an IDS parsing error, an Athena failure, or a pipeline timeout—and address it before it impacts scientists, data scientists, or downstream systems.
2. Operational Insights: Strategic Optimization
Operational Insights turn platform activity into clear evidence of value, helping leaders and admins optimize both infrastructure and investment.
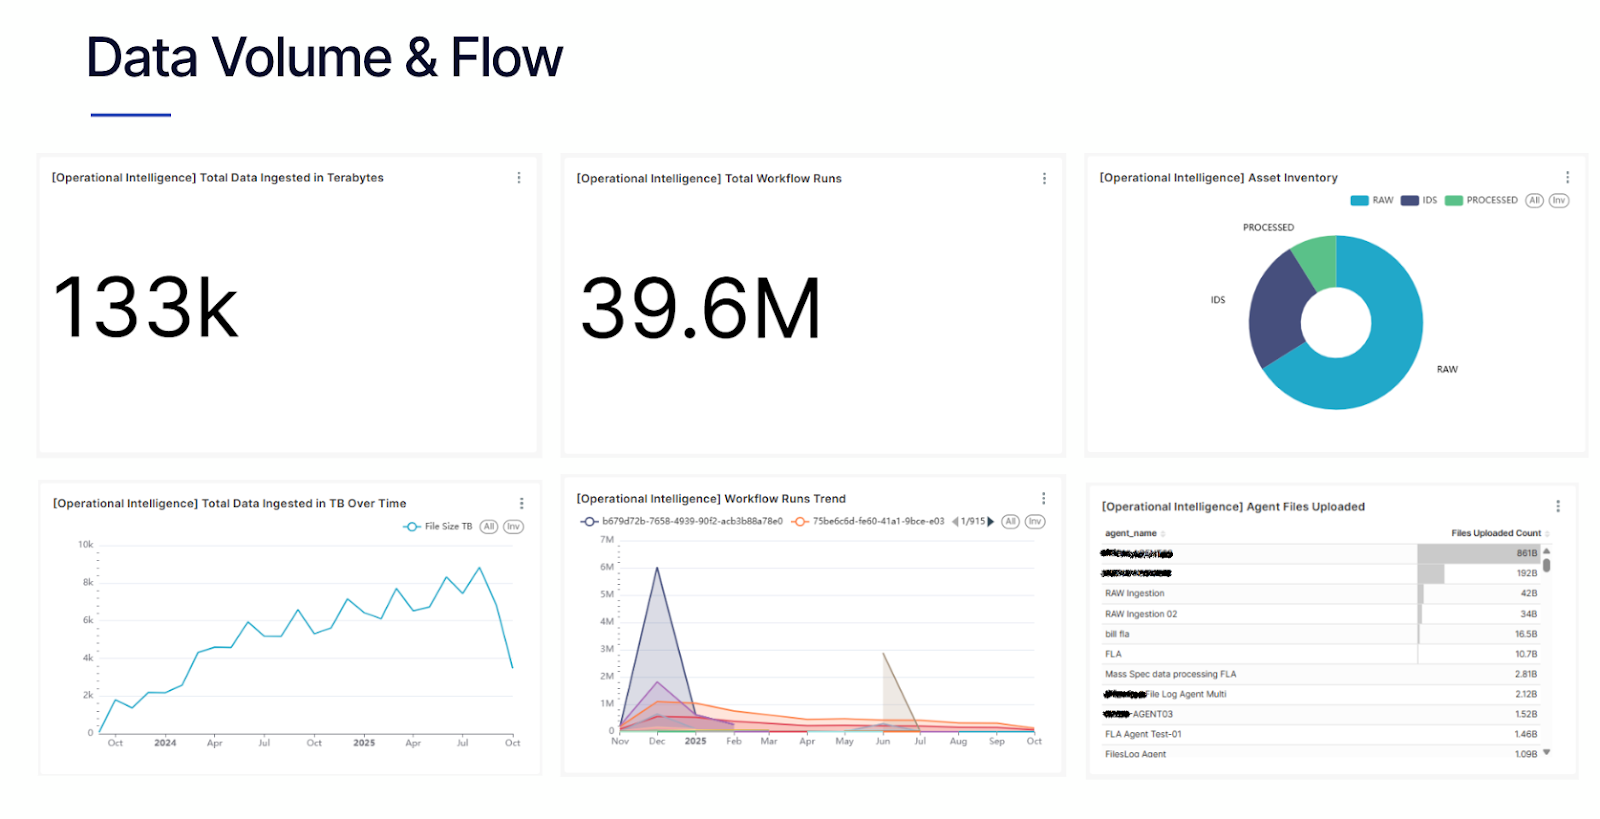
- Data Flow & Asset Inventory: Map where scientific data resides, how much data is moving through the platform, and how it flows into downstream AI/ML workflows. This includes visibility into data volumes, file counts, pipeline activity, and overall asset inventory.
- Cost Governance: Gain granular visibility into storage and compute costs, including S3 and Databricks, to identify cost drivers, spot unexpected increases, and forecast future usage. (coming soon!)
- Adoption Analytics: Track user engagement trends across departments, projects, and geographies, including data app usage, search activity, and download trends, to understand how data is being discovered, reused, and where adoption is increasing or slowing.
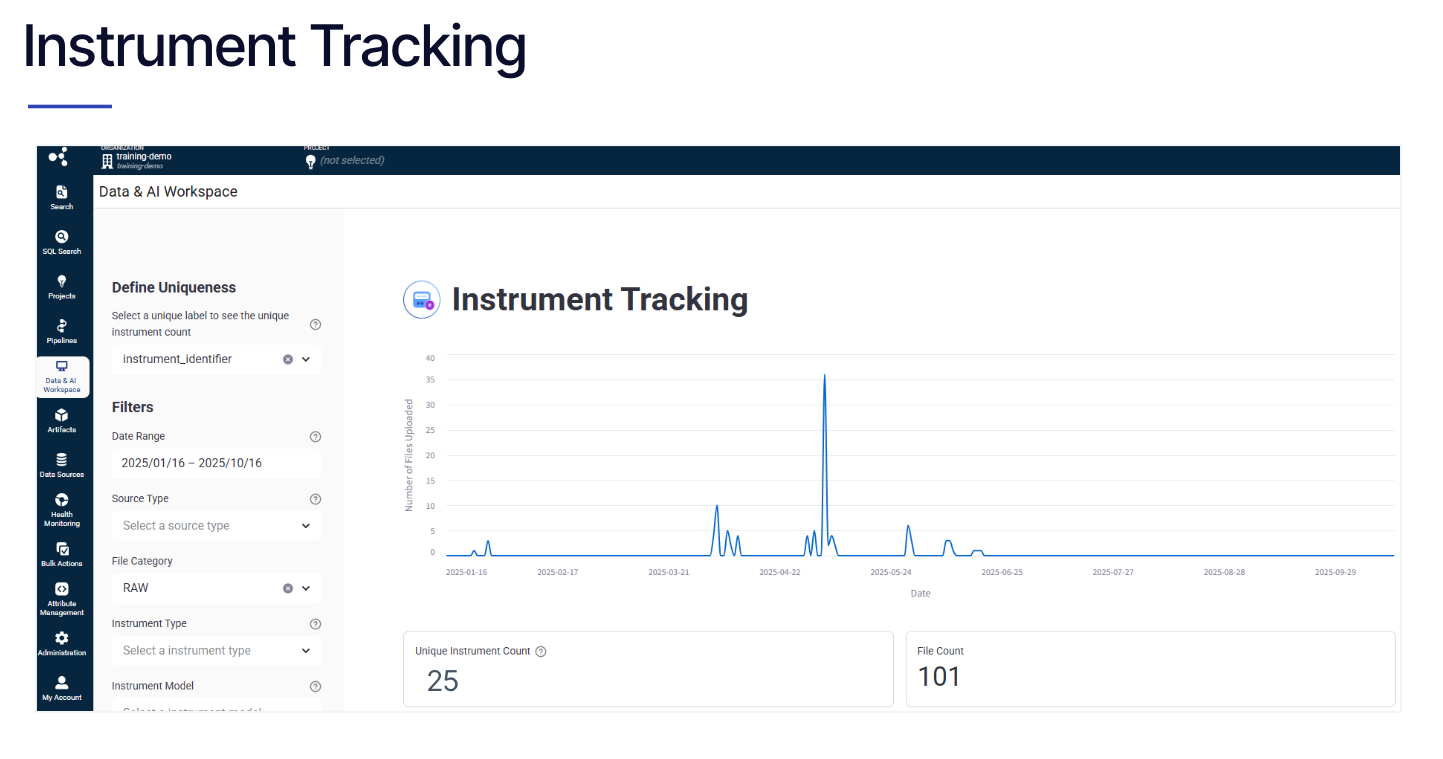
- Instrument Utilization: Track unique connected instrument counts to ensure licenses are fully utilized and infrastructure is sized appropriately.
3. Alert Management: Proactive Governance
Admins and leaders cannot afford to be reactive when working on drugs for patients where every day matters.
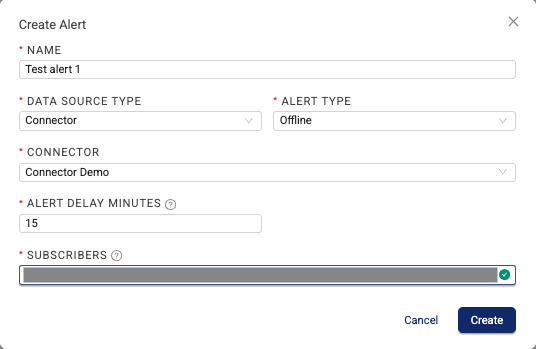
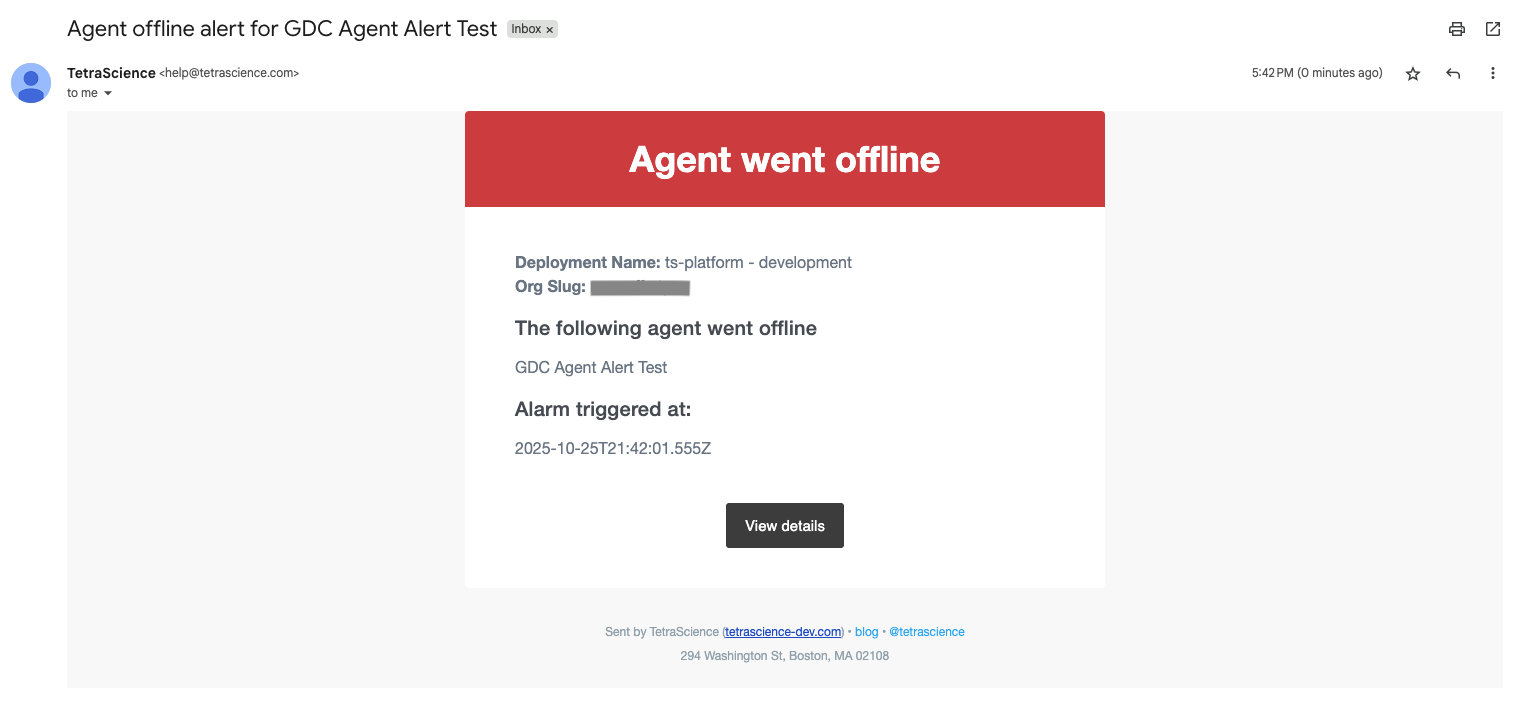
- Automated Notifications: Shift from manual dashboard checks to automated email alerts triggered by specific operational disruptions
- Custom Thresholds: Set email alerts for when key metrics fall outside expected ranges, such as sudden drops in data ingestion or increase in failure rates.
- Downtime Minimization: Configure instant alerts when agents, connectors or pipeline failures to enable faster response and minimize disruption to scientific workflows.
The Roadmap: An AI-Powered “Control Tower”
The future of Operational Intelligence is not just about human-led analysis; it’s about autonomous recommendations.
The Operational Intelligence Assistant
The ultimate goal is a "Control Tower" powered by AI. Our upcoming Operational Intelligence Agents will allow you to ask natural language questions and receive recommendations such as:
- "Which workflows have the highest ROI relative to their compute cost?”
- "Show me a list of all raw data files ingested globally in the last 24 hours that haven't successfully completed their primary processing pipeline."
- "Which departments have the highest frequency of manual file re-processing, and is it tied to a specific instrument model?"
- "Compare the data ingestion latency of our San Diego lab versus our Boston lab—what is the primary component causing the difference?"
By transforming raw data into near real-time, actionable intelligence, TetraScience is enabling IT and Digital Transformation leaders to show—not just tell—how they are increasing efficiency and accelerating cycle time.
Learn More
- Talk to your TetraScience team about Operational Intelligence
- Explore technical documentation at developers.tetrascience.com

